So you have seen the above image by now, right?
Let me explain the above image in brief.
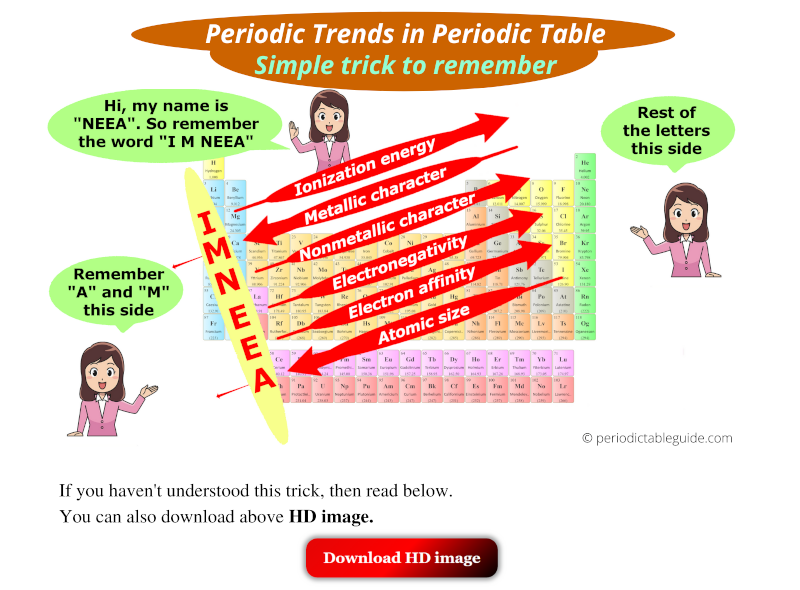
There is a girl named Neea. So remember the word “I M NEEA”.
Where,
I = Ionization energy
M = Metallic character
N = Nonmetallic character
E = Electronegativity
E = Electron affinity
A = Atomic size
(See “I M NEEA” written vertically in above image)
Now, from this word “I M NEEA”, remember that A and M are towards the left side, and rest of the letters are on the right side.
Red arrow facing towards Bottom-Left (↙) indicates that…
Top to bottom: property of elements increases, and also
Right to left: property of elements increases.
For example,
Atomic size has an arrow towards bottom left (↙). So atomic size increases from top to bottom and also it increases from right to left.
Red arrow facing towards Top-Right (↗) indicates that…
Bottom to top: property of elements increases, and also
Left to right: property of elements increases.
For example,
Ionization energy has an arrow towards top right (↗). So ionization energy increases from bottom to top and also it increases from left to right.
Now further, I have explained all the Periodic trends with images and I have also given you a simple trick to remember each trends in Periodic table.
Let’s dive straight into it.
But before that if you want to jump to your interested topic, then click on the below topics.
#2 Periodic trends: Atomic radius
#3 Periodic trends: Metallic character
#4 Periodic trends: Non metallic character
#5 Periodic trends: Electronegativity
#6 Periodic trends: Electron affinity
#7 Periodic trends: Ionization energy
What are Periodic trends?

You feel hot in summer and cold in winter. That means the climate or weather changes throughout the year starting from January to December.
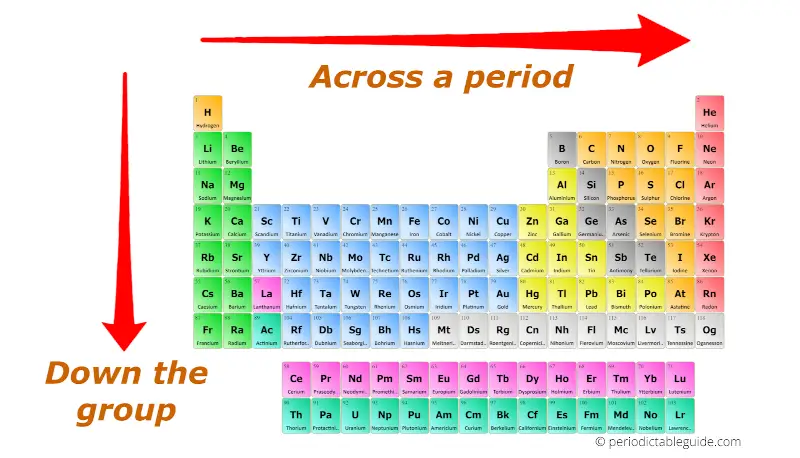
Just as the weather changes during the entire year, the properties of elements also change along the groups and periods in the Periodic table.
Periodic Trends: The change in properties of elements down the groups (from top to bottom) and across the periods (from left to right) in the Periodic table is known as Periodic trends.
We generally measure these trends (change in properties of elements) down the group and across the period.
I’ll explain to you the variation of following properties in the periodic table.
- Valency
- Atomic size
- Metallic character
- Non metallic character
- Electronegativity
- Electron affinity
- Ionization energy
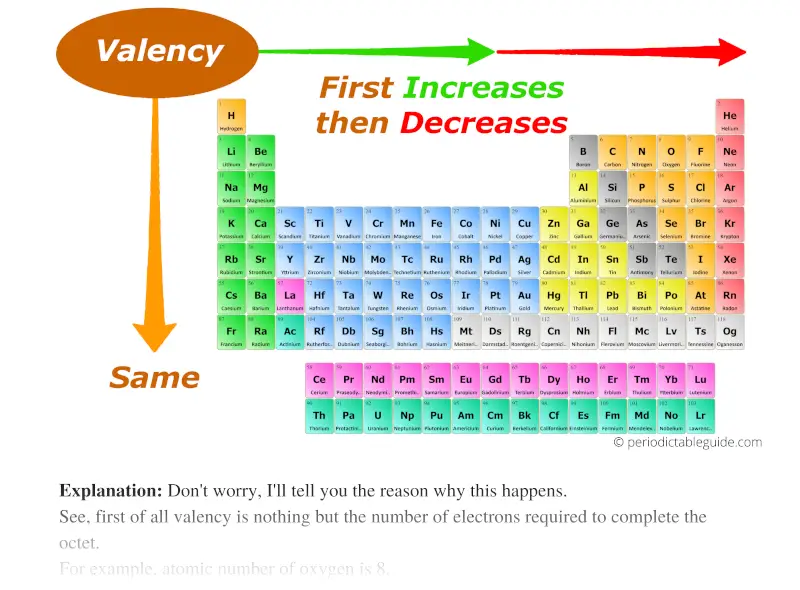
Periodic trends: Valency
As we move across the period (from left to right), the Valency of the elements first increases and then decreases. While moving down the group (from top to bottom), the Valency of elements remains the same.
Don’t worry, I’ll tell you the reason why this happens.
See, first of all valency is nothing but the number of electrons required to complete the octet.
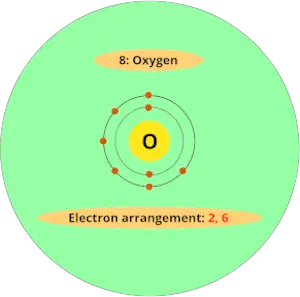
For example, atomic number of oxygen element is 8. That means oxygen has total 8 electrons.
So it’s electron arrangement is (2, 6).
It has 2 electrons in first orbit and other 6 electrons in second orbit.
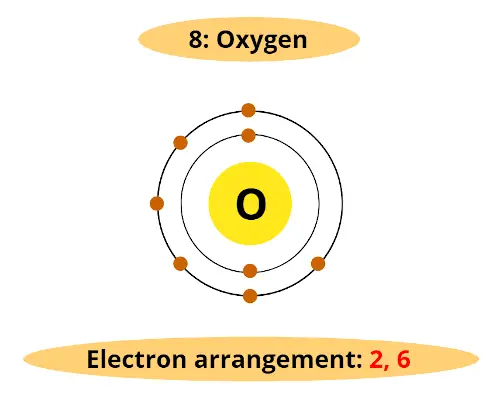
You can see that oxygen has 6 electrons in its outermost orbit.
Thus, it requires 2 electrons to complete the octet.
Hence valency of oxygen is 2.
As we move across the period (from left to right), the Valency of elements first increases and then decreases.
And along the group, the Valency remains constant, because you know very well that the number of electrons in the outermost orbit remains the same for all the elements of the same group.
Also visit: Valency of first 30 elements of periodic table.
Atomic radius trend in Periodic table
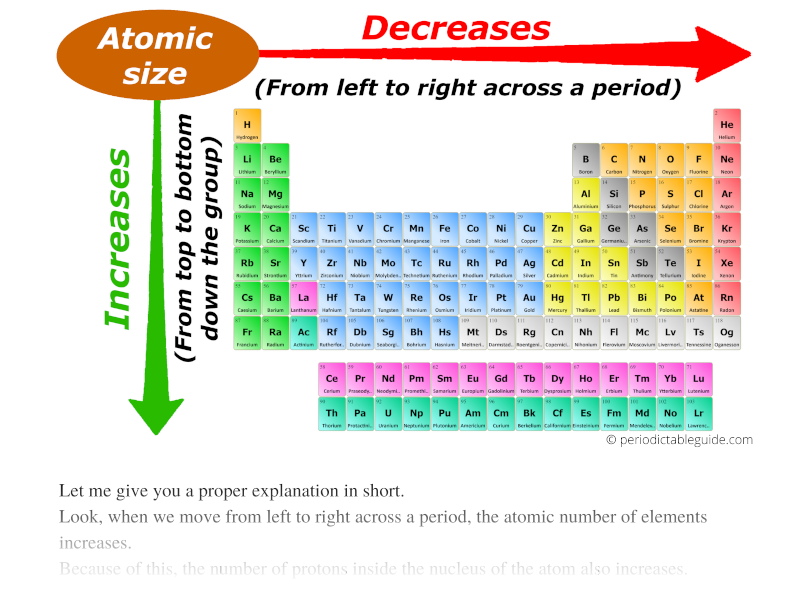
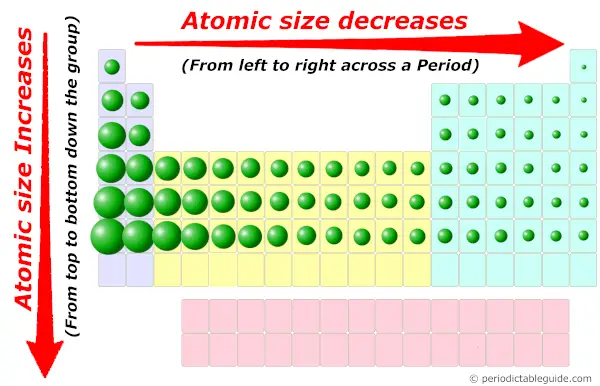
As we move across the period (from left to right), the atomic radius or atomic size of elements decreases. While moving down in the group (from top to bottom), the atomic radius increases.
I know, you have not understood anything from this statement.
So let me give you a proper explanation in short.
Look, when we move from left to right across a period, the atomic number of elements increases.
Because of this, the number of protons inside the nucleus of the atom also increases.
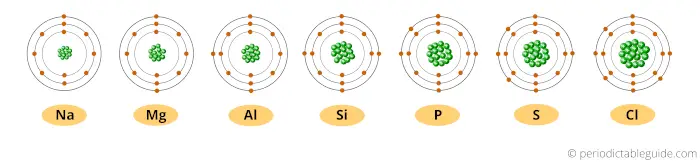
And more number of protons means more amount of positive charge.
Here the nucleus is positively charged, and the electrons revolving around the nucleus are negatively charged.
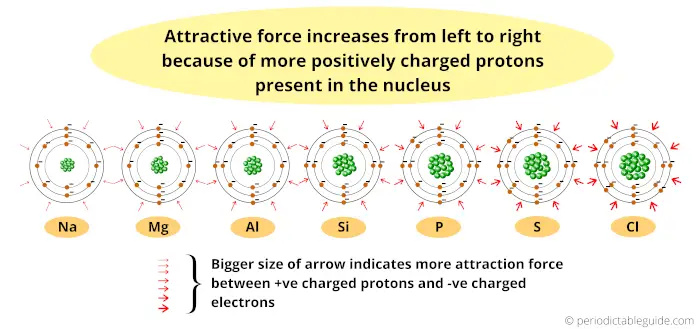
Thus the attractive force between the positively charged nucleus and negatively charged electrons increases (as we move from left to right across the period.)
Also the elements possess the same number of orbits.
So finally I want to say that, because of more attractive force and the same number of orbits across the period, the size of an atom shrinks.
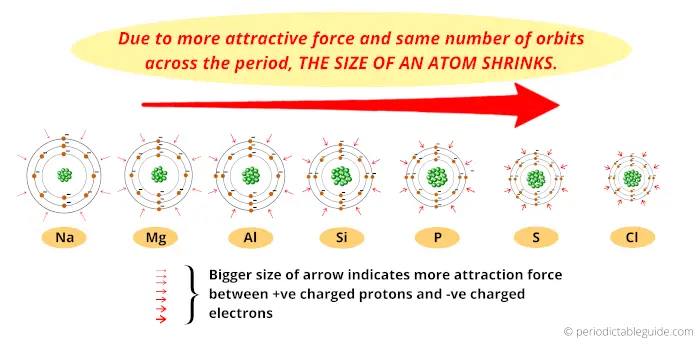
Thus, as we move from left to right across the period, the Atomic size decreases.
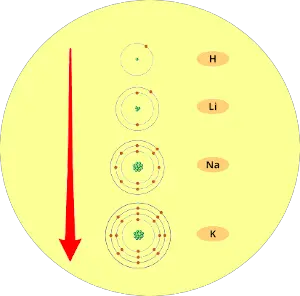
Now, as we move down the group, the number of orbits increases.
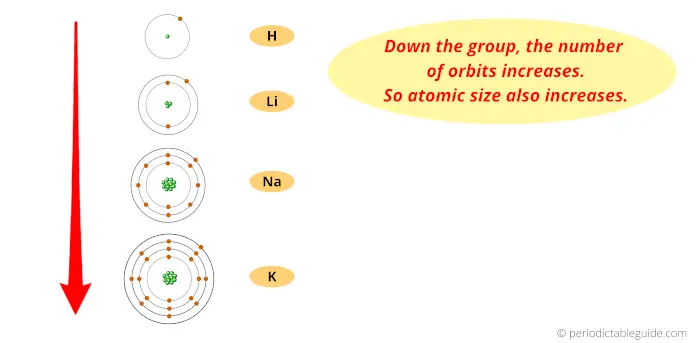
And as the number of orbits increases, the size of the atom increases.
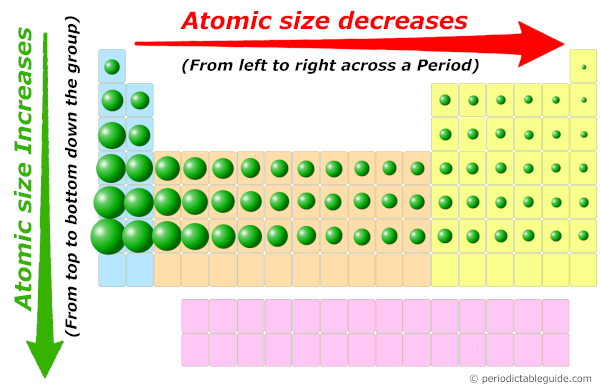
Thus finally you can imagine the atomic size of elements looks something similar to this above image.
Also visit: Periodic table showing atomic radius values of all elements.
Metallic character trend on Periodic table
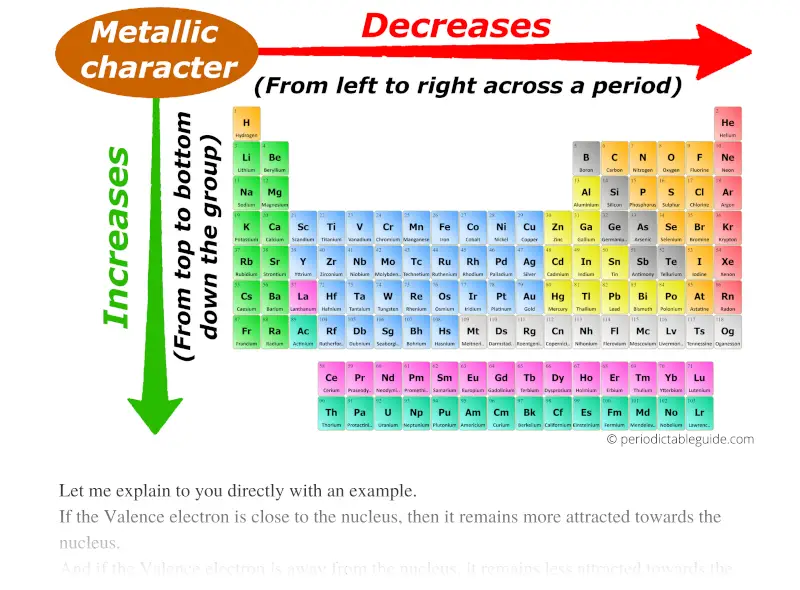
Trust me, metallic character trend in periodic table is really simple.
Let’s together find out the metallic character trend in periodic table.
Firstly, I want to tell you one property of metals.
- Metals are electron donors (metals loses/donates electrons)
Now see, metals have a tendency to lose electrons.
But, how does this loss of electrons take place?
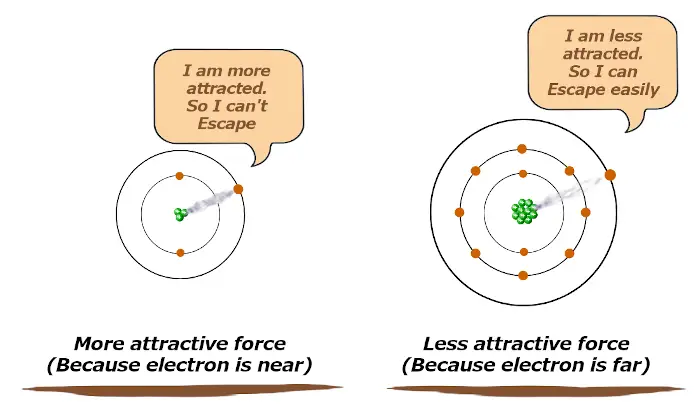
Let me explain to you directly with an example.
If the Valence electron is close to the nucleus, then it remains more attracted towards the nucleus.
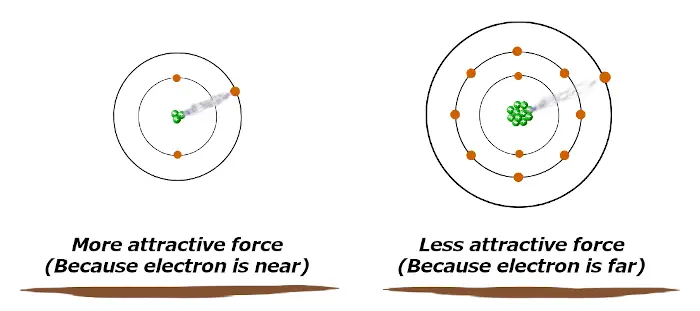
And if the Valence electron is away from the nucleus, it remains less attracted towards the nucleus.
If the attractive force is more, then the atom will not lose its electron easily.
And if the attractive force is less, then the atom will lose its electron very easily.
In other words, if the atomic size is bigger, then it will lose electrons easily and that is the property of metals. (Metals are electron donors or they loses electrons)
So, as the atomic size increases, the metallic character increases.

That’s it !!
Summary:
So as a summary, you should remember that metallic character (losing of electrons) depends on the size of atom.
Now, atomic size decreases from left to right across a period, which keeps the electrons attracted towards the nucleus.
So atoms will not lose electrons easily and thus metallic character decreases across a period (from left to right).
Now let us talk about the variation of metallic character down the group.
One question to you.
What about the size of atoms as we move down the group (from top to bottom)?
It increases. Right? (Because the number of shells or orbits increases as we move down the group)
So as the number of shells increases, the atomic size increases.
Now as the atomic size increases, the attractive force between the electron and nucleus decreases.
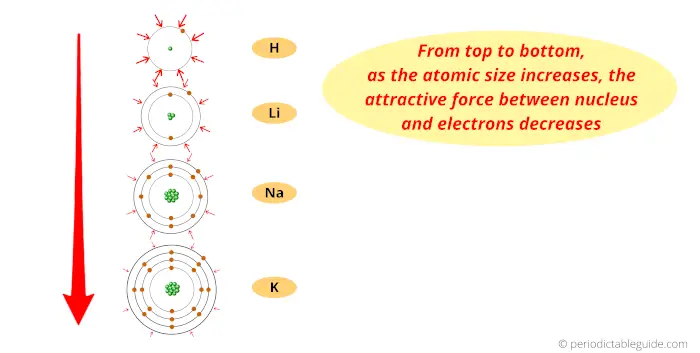
Thus the electron will be lost very easily, which is a property of metals.
Thus down the group (from top to bottom), the Metallic character increases.
Finally you can remember the metallic character by this single arrow.
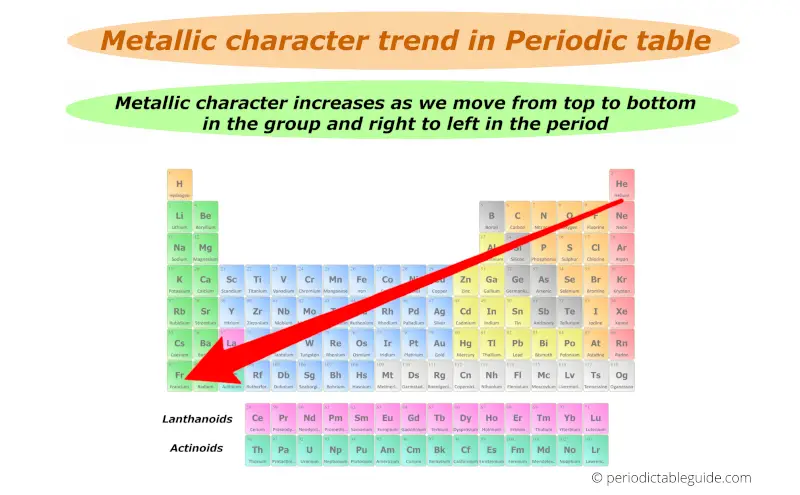
Best metals lies in the left bottom corner while best non metals lies in the top right corner of the periodic table (except group 18 elements.)
(Note: Group 18 elements are inert gases)
Also visit: Different types of metals on periodic table
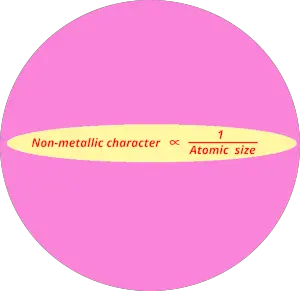
Non metallic character trend on Periodic table
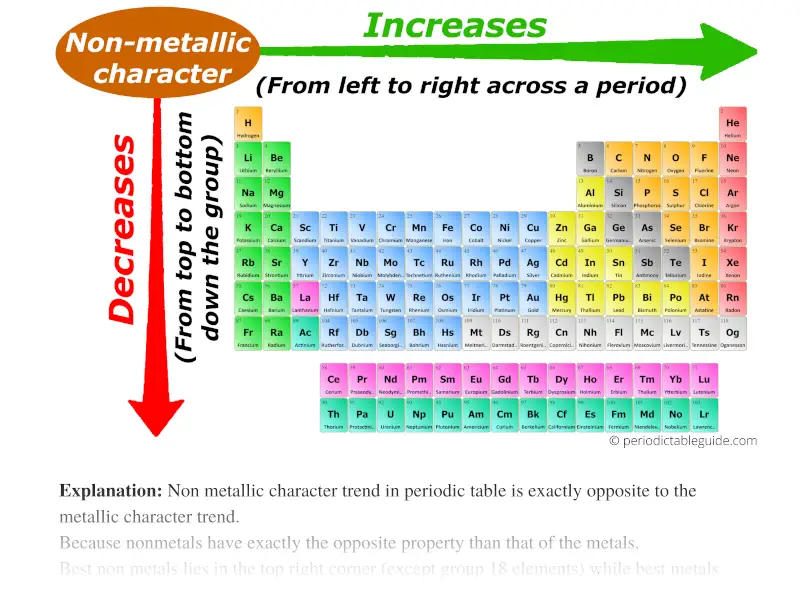
As we move across the period (from left to right), the non metallic character of elements increases. While moving down in the group (from top to bottom), the non metallic character decreases.
Non metallic character trend in periodic table is exactly opposite to the metallic character trend.
Because nonmetals have exactly the opposite property than that of the metals.
- Nonmetals are electrons gainers (nonmetals accept/gains electrons)
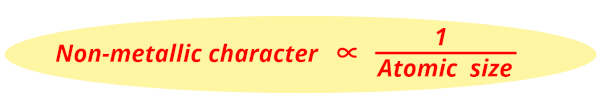
You can also remember the non metallic character from the equation below.
Non metallic character trend in periodic table is shown in below image.
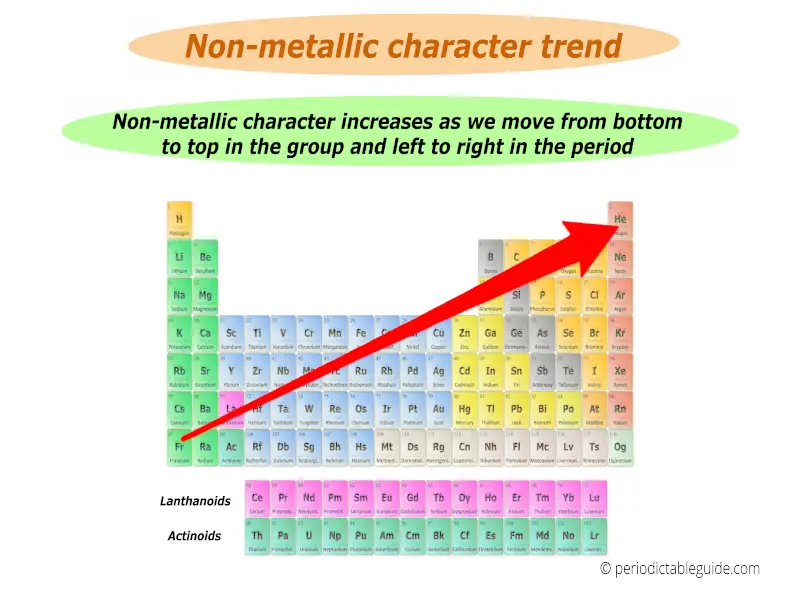
Best non metals lies in the top right corner (except group 18 elements) while best metals lies in the left bottom corner of the periodic table.
(Note: Group 18 elements are inert gases)
Also visit: Periodic table labelled with metals, nonmetals and metalloids.
Electronegativity trend in Periodic table
First of all,
What is Electronegativity?
Short answer: Electronegativity is a tendency to attract the shared pair of electrons.
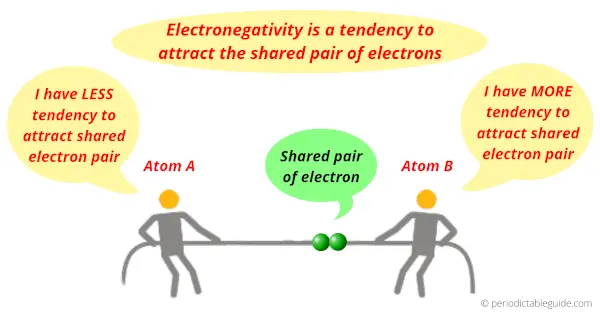
Definition: Electronegativity is a concept that describes the tendency of an atom to attract the shared pair of electrons.
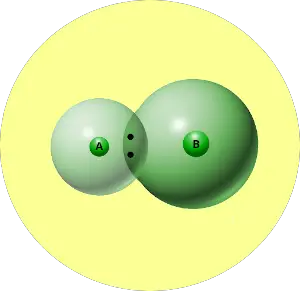
Let me explain electronegativity with a short example.
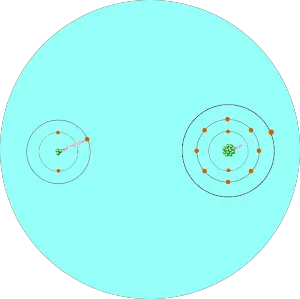
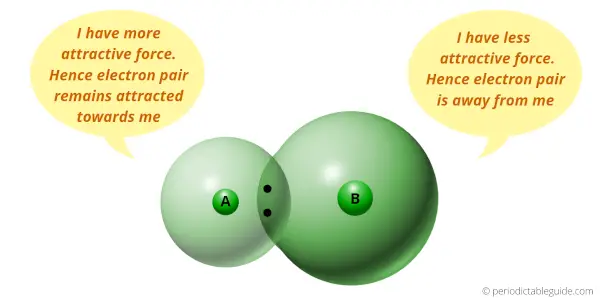
You can see that two atoms A and B combine to form a compound.
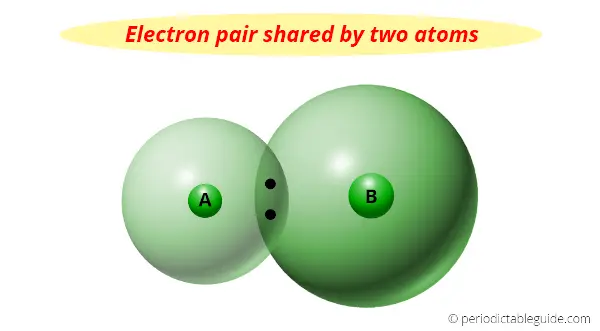
The electron pair shared by these two atoms is shown in the above picture.
Now, what actually happens with this pair of electrons?
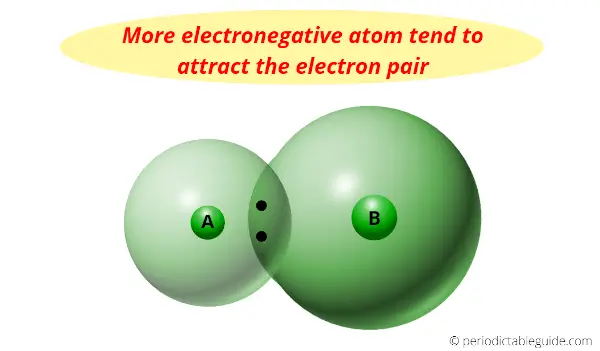
This pair of electrons tends to remain attracted towards the atom which is more electronegative.
Thus the phenomenon in which the shared electron pair tends to remain attracted towards one of the atoms is known as Electronegativity.
Now a big question, why does this happen?
Well, the concept is very simple.
Let me explain to you directly with an example.
If the size of the atom is less, then it will exert more attractive force on the electron pair.
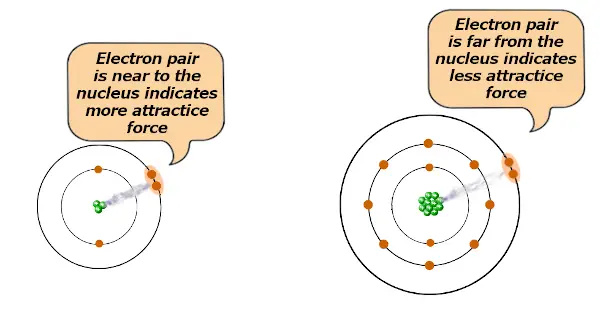
And if the size of the atom is large, then it will exert less attractive force on the electron pair.
If the attractive force is more, then the electron pair tends to remain closer towards the atom.
And if the attractive force is less, then the electron pair will not remain closer towards the atom.
In other words, if the atomic size is less, then it will attract the electron pair and this is termed as Electronegativity.
(In other words, lesser the size of an atom, more is the attractive force towards the electron pair, and hence the more Electronegativity.
Or
More the size of atom, lesser the attractive force towards the electron pair, and hence the lesser Electronegativity)
So, as the atomic size decreases, the Electronegativity increases.

That’s it !!
So, down the group (from top to bottom), the atomic size increases. So Electronegativity decreases.
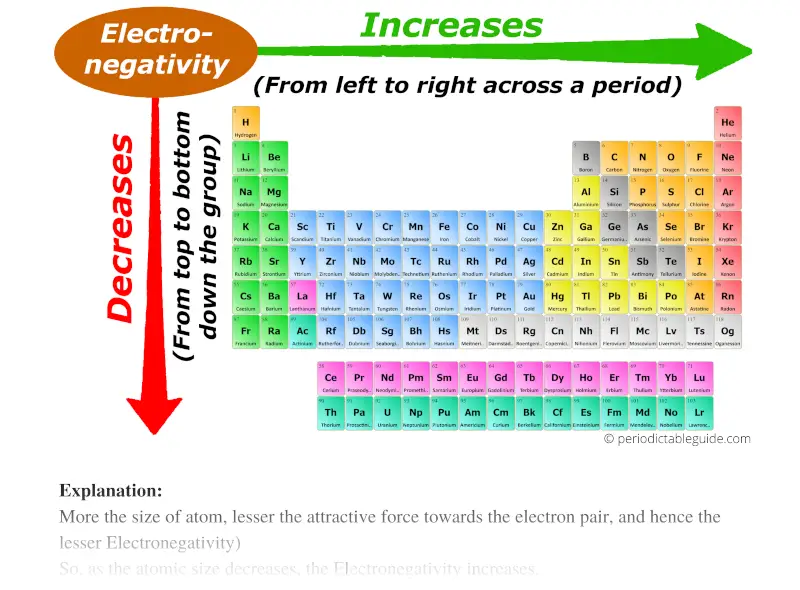
And across the period (from left to right), the atomic size decreases, so the Electronegativity increases.
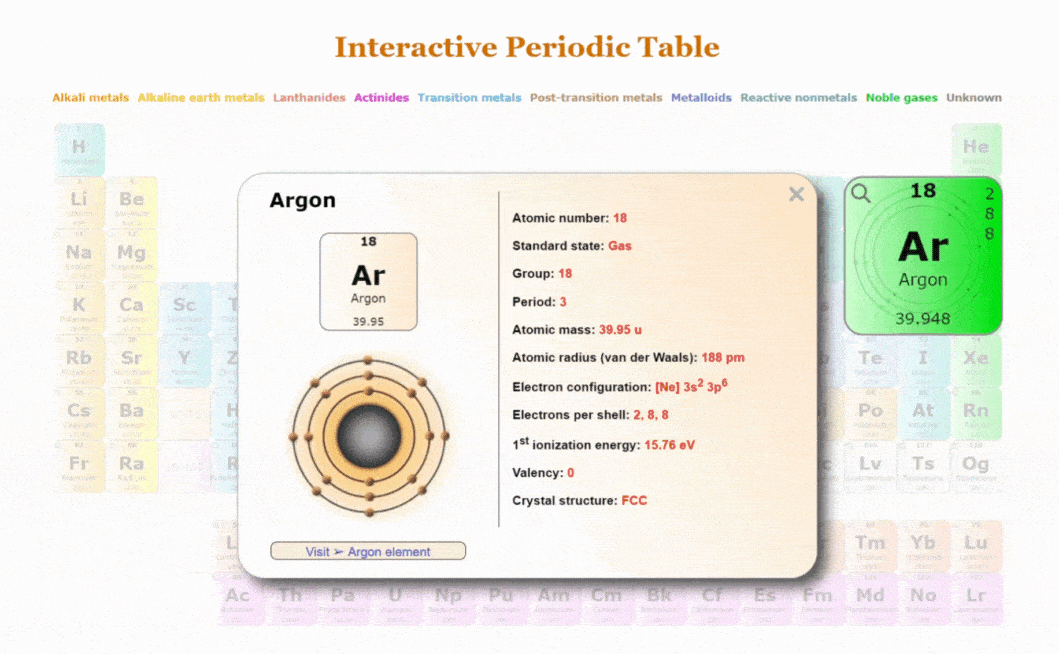
For electronegativity values of elements, visit Interactive periodic table. (From here you will get the values of electronegativity of all the elements in a single periodic table.)
Electron affinity trend in Periodic table
First of all, let me tell you what electron affinity is.
Affinity means attraction.
Definition: Electron affinity is defined as the amount of energy released when an electron is added in the outermost shell of an isolated gaseous atom.
In simple words, electron affinity is the tendency of an atom to accept the electron.
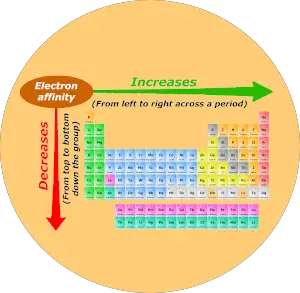
Now I’ll tell you about the Electron affinity trend in the periodic table.
Actually there are many factors which affect the electron affinity, but to make it simple and easy to remember, I’ll explain to you with a simple logic.
You already know about the atomic size trend in periodic table.
Atomic size decreases across the period (from left to right) and it increases down the group (from top to bottom.)
Now, what does the small size of an atom indicate?
Small size indicates that the nucleus has more attractive force.
That means small size atoms has more tendency to accept any free electron.
So finally we can say that, less the size of atom, more will be the electron affinity (tendency to accept electron)
In other words, electron affinity is inversely proportional to the atomic size.

Now, as we move across the period (from left to right), the atomic size decreases. Thus electron affinity increases across the period (from left to right.)

And as we move down the group (from top to bottom), the atomic size increases. Thus the electron affinity decreases down the group (from top to bottom.)
Remember:
- Electron affinity and electron gain enthalpy are similar to each other. The difference between electron affinity and electron gain enthalpy is that they have different sign conventions.
- Sign convention for Electron Gain Enthalpy is;
- Negative: When energy is released during accepting an electron.
- Positive: When energy is supplied to an atom while adding an electron.
- Sign of electron affinity is opposite to the sign of electron gain enthalpy.
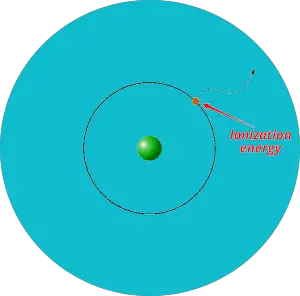
Ionization energy trend in periodic table
First of all, what is ionization energy?
Definition: Ionization energy is the minimum energy required to remove an electron from the gaseous atom or ion.
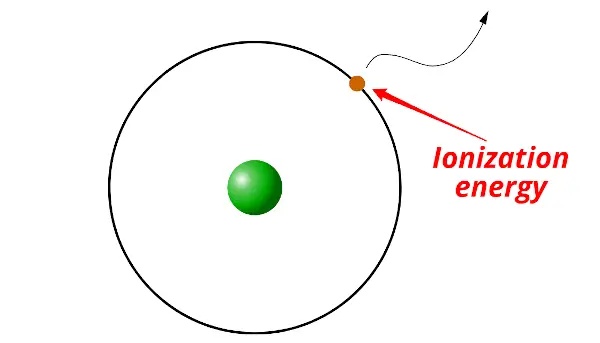
In simple words, the electron itself cannot escape out of the orbit. It requires some external energy to be supplied on it in order to escape out of the orbit. And this required energy is known as ionization energy.
In other words, ionization energy is the measurement of strength by which an electron is bounded or it is the measurement of the difficulty of removing the electron.
More the ionization energy, more is the difficulty to remove the electron (means we have to supply more energy to remove the electron).
And lesser the ionization energy, lesser is the difficulty to remove the electron (means we have to supply less energy to remove the electron).
Now it is very easy for you to understand the trend of ionization energy in periodic table.
You already know about the atomic size trend in periodic table.
Atomic size decreases across the period (from left to right) and it increases down the group (from top to bottom.)
Now again, what does the small size of an atom indicate?
Yes, small size indicates that the nucleus has more attractive force.
That means for a smaller size atom, it becomes more difficult to remove the electron from the orbit.
So finally we can say that, less the size of atom, more will be the ionization energy (energy required to remove the electron).
And bigger the size, lesser will be the ionization energy.
In other words, ionization energy is inversely proportional to the atomic size.

Now, as we move across the period (from left to right), the atomic size decreases. Thus ionization energy increases across the period (from left to right.)
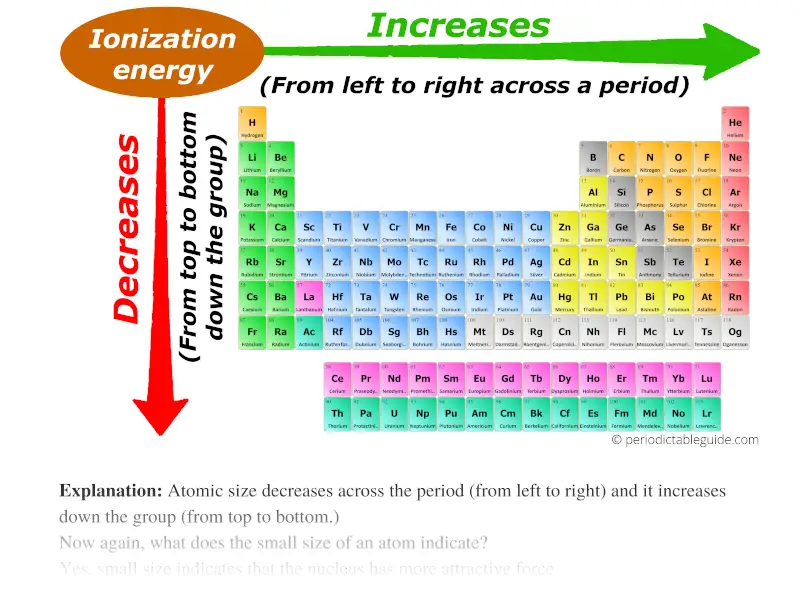
And as we move down the group (from top to bottom), the atomic size increases. Thus the ionization energy decreases down the group (from top to bottom.)
(Side Note: As we move down the group, the positive nuclear charge increases. So there should be more attraction of electrons towards the nucleus. But comparatively, more electron shells are added to the atoms as we move down the group. This makes the electron far from the nucleus, which results in less attractive force between the nucleus and outermost electron.)
Summary of trends in periodic table
So based on the very first image, we can easily remember the Periodic trends in Periodic table.
Let’s revise them very quickly.
Ionization energy trend (↗)
Across the period (from left to right): Increases
Down the group (from top to bottom): Decreases
Metallic character trend (↙)
Across the period (from left to right): Decreases
Down the group (from top to bottom): Increases
Nonmetallic character trend (↗)
Across the period (from left to right): Increases
Down the group (from top to bottom): Decreases
Electronegativity trend (↗)
Across the period (from left to right): Increases
Down the group (from top to bottom): Decreases
Electron affinity trend (↗)
Across the period (from left to right): Increases
Down the group (from top to bottom): Decreases
Atomic size trend (↙)
Across the period (from left to right): Decreases
Down the group (from top to bottom): Increases
I hope this article is very very helpful to you.
Now I want to know, have you understood the technique to memorize the trends of Periodic table?
Let me know by leaving a comment below.
Explore our New Interactive Periodic Table (with Rotating Bohr Models and More)
Details about this Periodic table:
- Access detailed info on all elements: atomic mass, electron configurations, charges, and more.
- View rotating Bohr models for all 118 elements.
- Get a free HD image of the Periodic Table.
Note: For future use, bookmark this Periodic table or visit “PeriodicTableGuide.com”
Suggested Important articles for you:
- Periodic table of elements (Detailed guide + HD image)
- Periodic table with metals
- Periodic table with nonmetals
- Periodic table with metalloids
- Periodic table with halogens
- Periodic table with noble gases
- Periodic table showing alkali metals
- Periodic table showing alkaline earth metals
- Periodic table with transition metals
- Periodic table with inner transition metals